Skip to content
Medicine

A topic from several perspectives

Apply this topic to your work →

The Chart

Explore the chart through the perspectives below. Compare their examples and tradeoffs, then connect what you learn to your own work.

Illustrated study

Making a pattern visible

A historical statistical diagram connects observation, health and visual explanation.

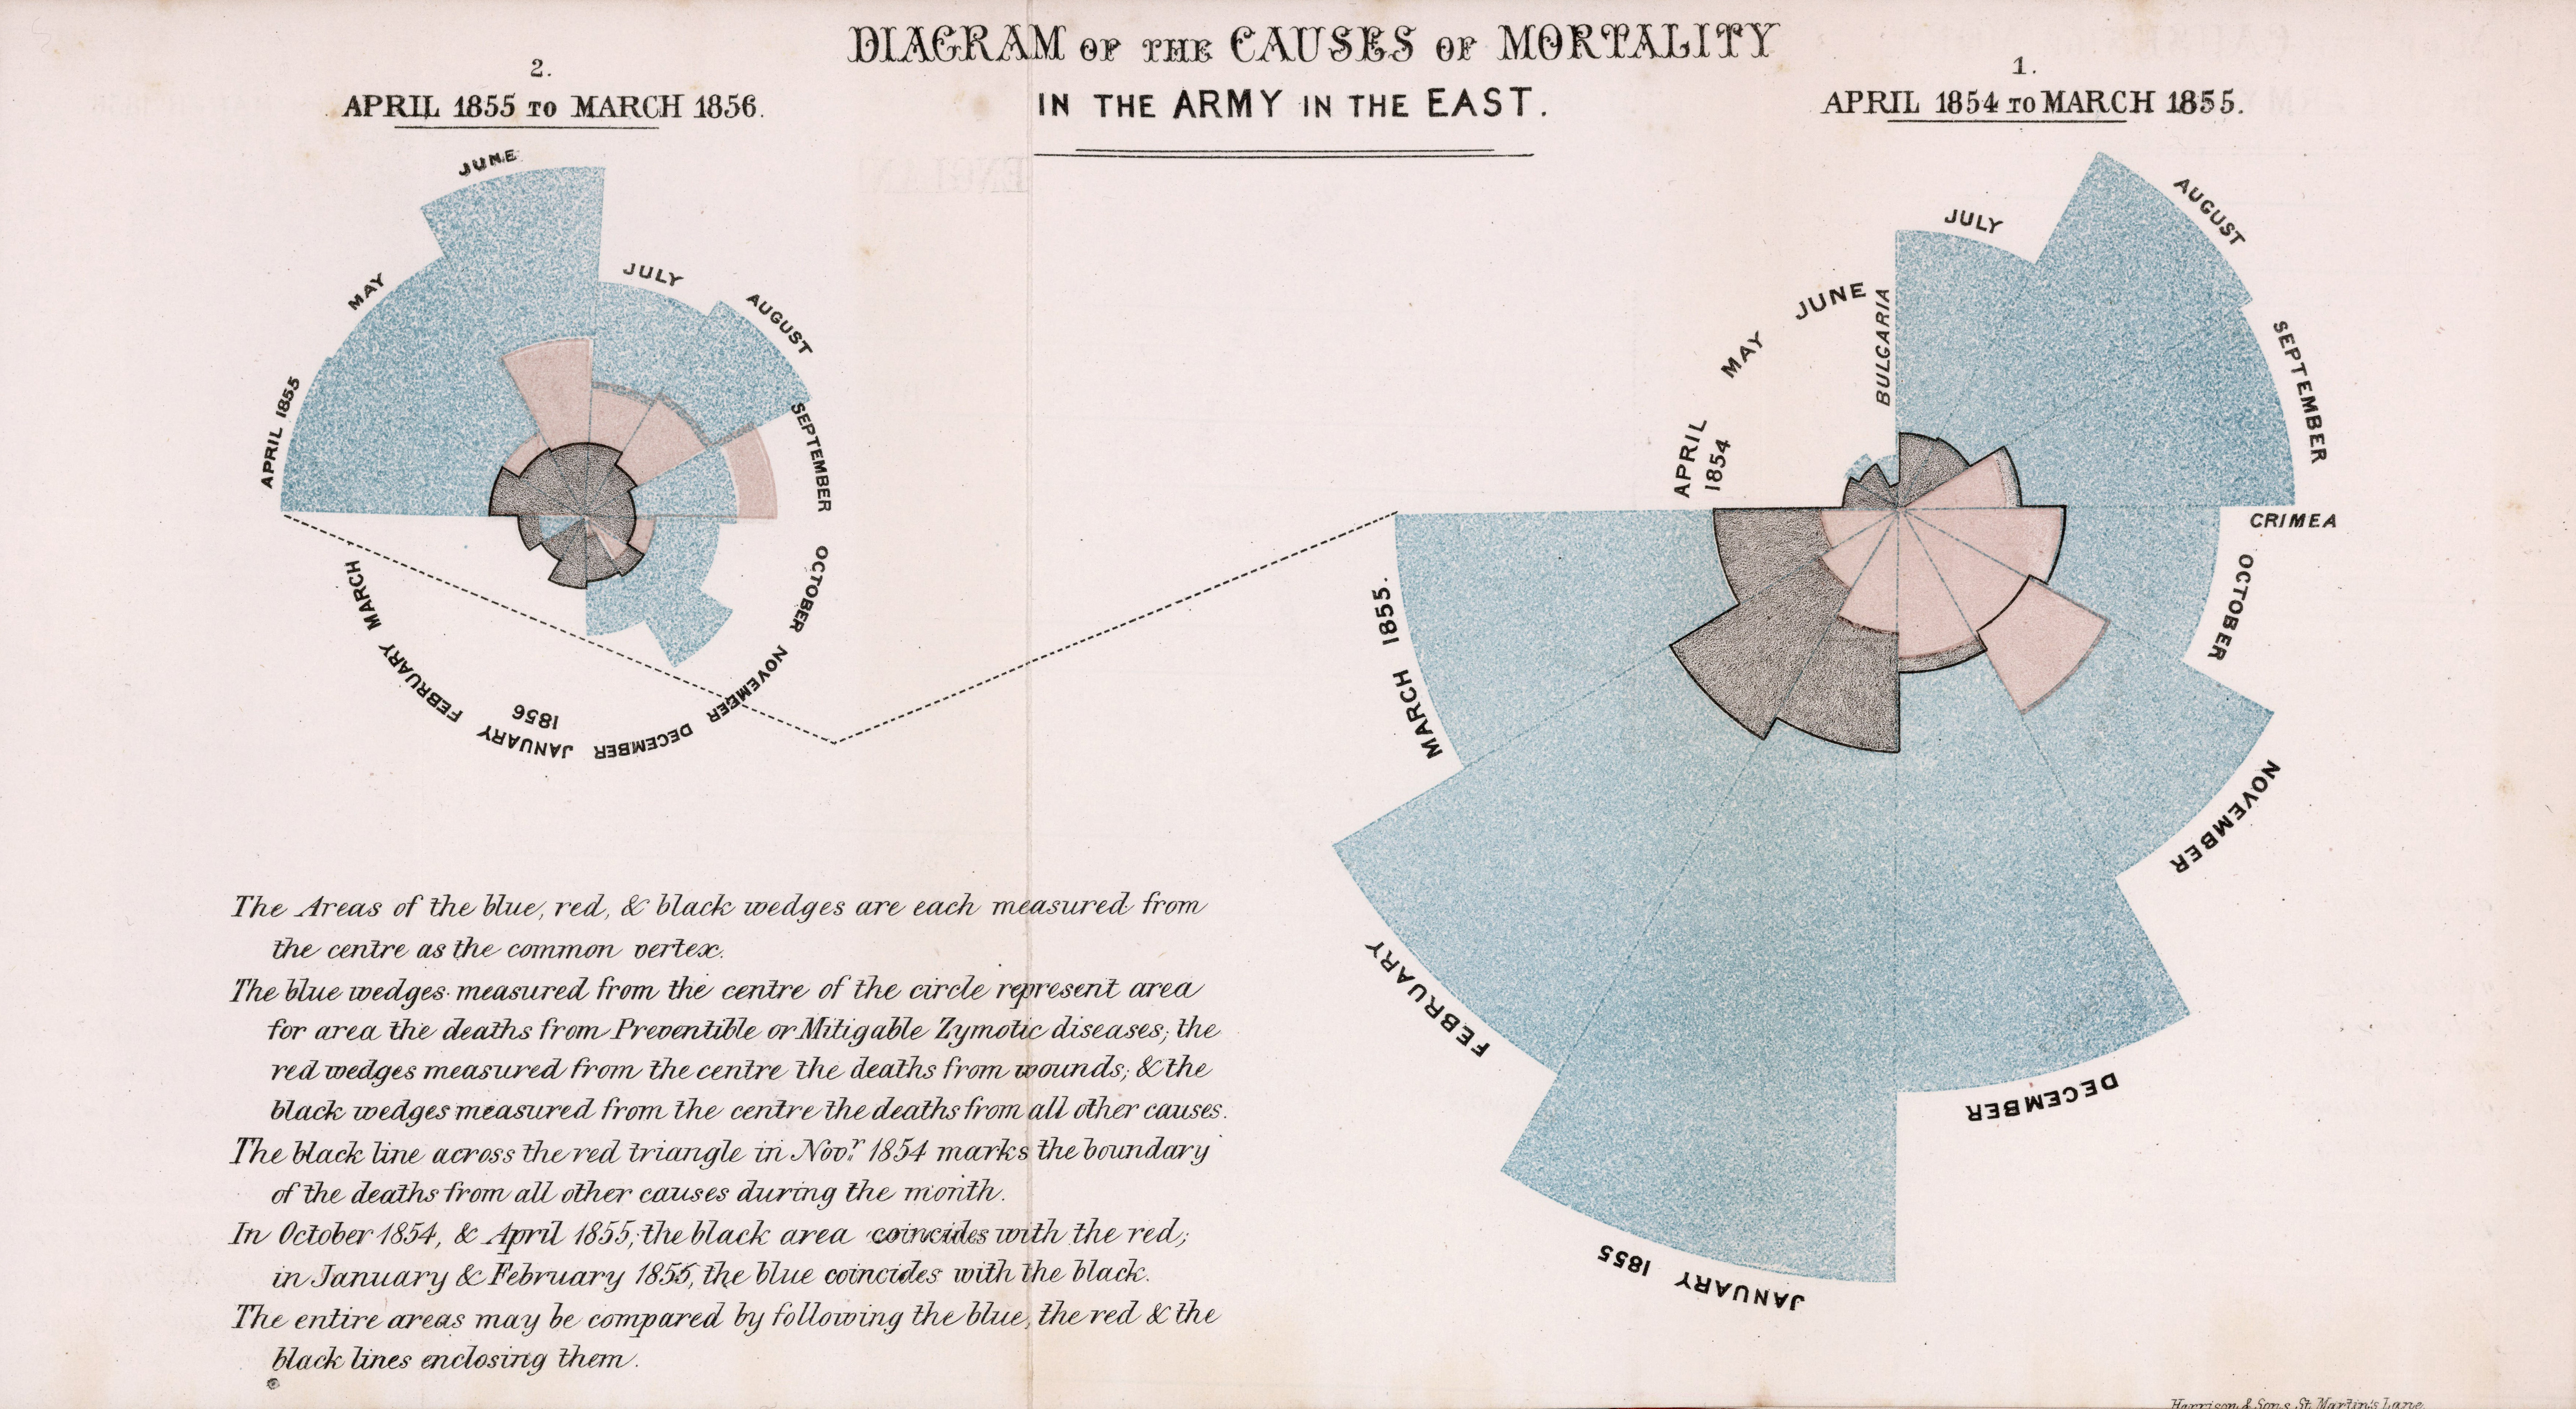
Two circular diagrams with monthly wedges in blue, red and black, comparing causes of mortality across two years, accompanied by a printed explanatory key.

Figure 1 · 1858

Diagram of the Causes of Mortality in the Army in the East

Begin with the key, then compare the two years. Each month occupies a wedge; the colored areas distinguish causes of death. Notice how much interpretation depends on the labels and explanation. This is a population-level historical diagram, rather than an individual patient chart.

Florence Nightingale · David Rumsey Map Collection · reproduction via Wikimedia Commons
Historical polar-area diagram

View full size ↗Download image
Collection record and reuse rights

Display copies are resized and compressed. Source and license links apply to the image above.

Explore more museum and archive collections →

Medicine · The Chart

Distinguish a record from an interpretation

Work with an invented record to see how dates, observations and interpretations can become confused. Use no real medical information.

Try this

Create three fictional entries and label the time, source and whether each is a report, observation or interpretation.

Reflect

What could a later reader mistakenly treat as established fact?

Take it further · optional follow-up

Give your invented entries to a reader without extra explanation. Ask which statements they interpret as observations, then revise ambiguous source labels.

Compare with another activity · Software

The Commit: Explain a change to a future reader →
Connect this activity with other subjects

Follow a question through three activities, with a worked example and a worksheet for your observations.

Prepared study prompt · not an editor-reviewed research article

Explore the perspectives

The eight prepared perspectives below are open to everyone. Sign in for expanded readings, a private notebook and collections.

Sign in for a deeper reading and notebook →

Historical

How did this evolve, and why has it endured?

Medical records evolved from individual case notes to standardized forms and digital systems. Changes in recordkeeping reflect shifts in professional practice, institutions and what information could be measured.

Human

How do people actually experience this?

A chart can help clinicians coordinate care, but its categories may not capture the full account a person gives of their experience. Reading a record requires attention to the patient's circumstances and the reason each entry was made.

Ethical

What responsibilities does this practice carry?

Medical records require confidentiality, appropriate access and careful correction procedures. An inference written as fact can travel through a system and affect later decisions.

Cultural

How have different societies approached this?

Record formats reflect assumptions about language, family relationships and what counts as relevant information. A standardized field may fit some experiences better than others.

Technical

How does it actually work?

Dates, sources, units, methods and uncertainty are essential metadata for clinical observations. A trend can be misleading if measurements were taken under different conditions or copied without context.

Debates

Where do thoughtful practitioners disagree?

Electronic records improve retrieval and coordination but can also create documentation burdens and propagate errors. Claims about their benefits should specify the outcome and setting being studied.

Economic

How has commerce shaped this?

Record systems require investment in software, training, security and maintenance. Interoperability can reduce repeated work, but implementation and governance have real costs.

Ecological

How does it meet the living world?

Digital records use devices, networks and data centers, while paper records use physical materials and storage. Environmental comparisons require full lifecycle evidence rather than assuming one format is automatically preferable.